Cash Flow Performance – Project Financial Analysis
BUSINESS SETTING


Vocabulary Preparation
Cash flow performance
→ The way money moves in and out of a project over a period of time.Actual cost
→ The real amount of money that has already been spent.Baseline cost
→ The originally approved budget used as a reference for comparison.Remaining cost
→ The estimated amount of money still needed to complete the project.Cost variance
→ The difference between planned costs and actual costs.On budget
→ Operating without exceeding the planned financial limits.Cost overrun
→ A situation where actual expenses are higher than expected.
Trends, Analysis & Forecasting
Spending patterns
→ The way expenses change or behave over time.Cumulative cost
→ The total cost accumulated up to a specific point in time.Upward trajectory
→ A continuous increase over a period of time.Peak spending
→ The moment when expenses reach their highest level.Taper off
→ To gradually decrease in amount or intensity.Front-loaded costs
→ Costs that occur mainly at the early stages of a project.
Project Management & Strategy
Assess financial efficiency
→ To evaluate how effectively money is being used.Anticipate future cost exposure
→ To predict potential financial risks or upcoming expenses.Tighten cost controls
→ To apply stricter rules to manage and limit spending.Monitor the burn rate
→ To track how quickly the budget is being spent.Deliver tangible value
→ To produce clear and measurable benefits.Data-driven decisions
→ Decisions based on facts and measurable information rather than intuition.
Business Idioms & Expressions
Keep spending under control
→ To manage expenses carefully and avoid excess.The heavy lifting is still ahead
→ The most difficult or expensive part has not happened yet.Snowball into a major issue
→ A small problem that grows into a much larger one.Stay on the ball
→ To remain alert, proactive, and fully engaged.On autopilot
→ Operating without active supervision or control.Well-positioned for success
→ In a strong situation to achieve positive results.
Presentation
Introduction
'Good morning everyone.
Today, I would like to walk you through the cash flow performance of the project, focusing on actual cost, baseline cost, remaining cost, and cost variance, as illustrated in the chart.
At a glance, this report allows us to track spending patterns, assess financial efficiency, and anticipate future cost exposure. In other words, it helps us understand whether the project is on budget, ahead of plan, or at risk of overruns.
Before diving into the details, it is worth highlighting that cash flow management is not just about numbers; it is about financial discipline, forecast accuracy, and informed decision-making.'
Development
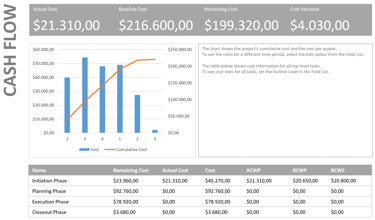
'To begin with, let’s look at the overall cost indicators displayed at the top of the chart.
The actual cost currently stands at $21,310, while the baseline cost is $216,600. Consequently, the remaining cost amounts to $199,320, leaving us with a cost variance of $4,030.
This variance suggests that spending is slightly above plan, but still within a manageable range.
Moving on to the chart itself, the blue bars represent periodic costs, whereas the orange line reflects the cumulative cost over time.
What we can clearly observe is that costs peaked during the early stages, particularly around periods three and four, before tapering off significantly toward the later stages. This pattern is fairly typical in projects where upfront investments are required to kick-start operations.
Moreover, the cumulative cost curve shows a steady upward trajectory, indicating that expenditures have been consistent rather than erratic. In business terms, this is a positive signal, as it suggests the project team has managed to keep spending under control and avoid financial shocks.
Now, shifting our attention to the table below, we can break down the costs by project phase.
The Initiation Phase has incurred an actual cost of $21,310, against a total cost of $45,270, leaving a remaining cost of $23,960. Interestingly, this phase also shows earned value metrics, such as ACWP, BCWP, and BCWS, which allows us to benchmark performance against planned progress.
In contrast, the Planning, Execution, and Closeout phases have not yet generated actual costs. However, they account for the bulk of the remaining budget, particularly the Planning and Execution phases.
This tells us that the project is still front-loaded in terms of spending, and the most cost-intensive stages are yet to come. As the saying goes, “the heavy lifting is still ahead of us.”
From a strategic standpoint, this is a critical moment. The project team must tighten cost controls, monitor burn rate closely, and ensure that future expenditures deliver tangible value. Otherwise, small variances today could snowball into major budget issues later on.'
Closing
'To sum up, the cash flow chart paints a picture of a project that is financially stable but not on autopilot.
On the one hand, costs are largely aligned with expectations, and the variance remains within acceptable limits. On the other hand, with a substantial portion of the budget still unspent, the project team must stay on the ball and keep a close eye on future disbursements.
In conclusion, effective cash flow management will be the key to delivering this project on time and on budget. If we continue to plan ahead, control costs, and make data-driven decisions, we can confidently say that the project is well-positioned for financial success.
Thank you for your attention.'